SLVUDF6 September 2025
4.2.1 Electricity Meter Metrology Accuracy Results
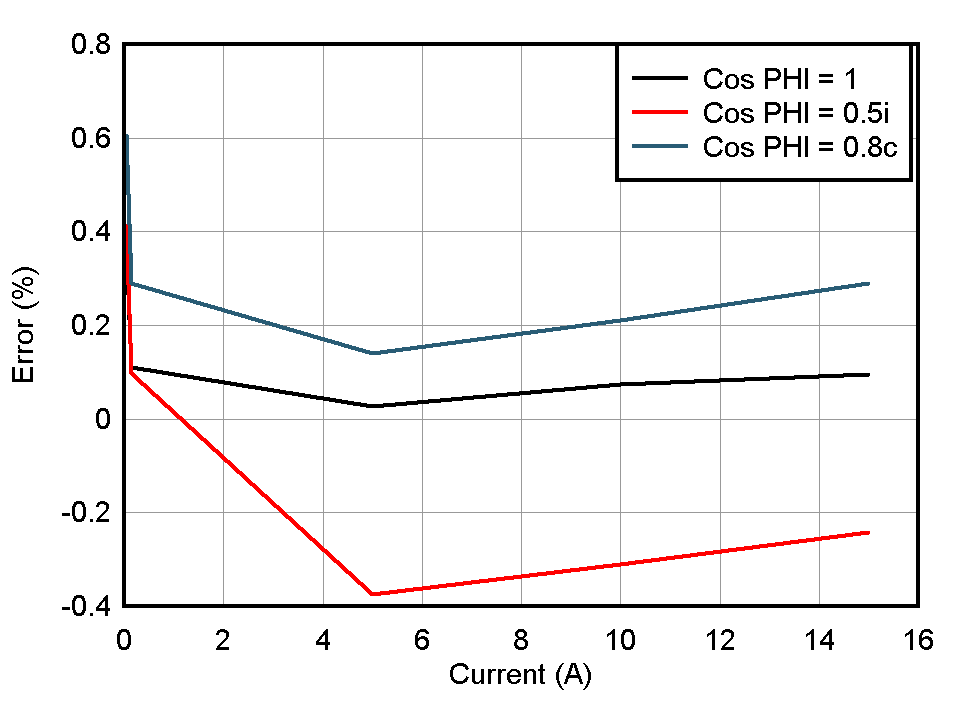
After gain, phase, and offset calibration, the test results are shown in the following tables. Table 4-2 and Figure 4-7 show the active energy test results.
| CURRENT (A) | AVG ERROR% PF=1 Cos PHI = 1 (0°) |
AVG ERROR%
PF=0.5i Cos PHI = 0.5i (60°) |
AVG ERROR%
PF=0.8c Cos PHI = 0.8c (–36.87°) |
|---|---|---|---|
| 0.05 |
0.368 |
0.413 |
0.605 |
|
0.15 |
0.111 |
0.098 |
0.29 |
|
5 |
0.026 |
-0.374 |
0.141 |
|
10 |
0.073 |
-0.311 |
0.21 |
| 15 |
0.096 |
-0.242 |
0.29 |
 Figure 4-7 Active Energy % Error Versus Current, 3mΩ Shunt, 230V
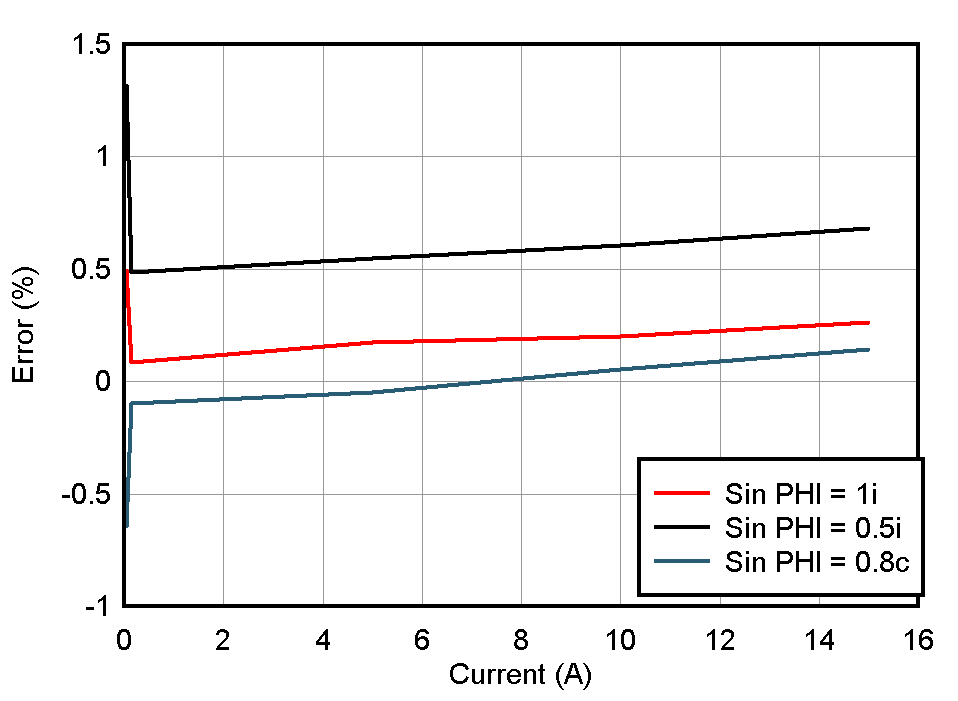
Table 4-3 and Figure 4-8 show the reactive energy test results.
| CURRENT (A) |
AVG ERROR% Sin PHI = 1i (90°) |
AVG ERROR% Sin PHI = 0.5i (30°) |
AVG ERROR% Sin PHI = 0.8c (–53.13°) |
|---|---|---|---|
|
0.05 |
0.494 |
1.316 |
-0.644 |
|
0.15 |
0.086 |
0.486 |
-0.097 |
|
5 |
0.172 |
0.549 |
-0.049 |
|
10 |
0.202 |
0.607 |
0.053 |
|
15 |
0.264 |
0.682 |
0.141 |
 Figure 4-8 Reactive Energy % Error Versus
Current, 3mΩ Shunts